Electrical Engineer Salary in Burlington, VT: $116,295 (2026)
Quick Answer:A full-time electrical engineer in Burlington, VT earns a median $116,295/year (≈ $55.91/hour) in nominal terms for 2026 — projected from BLS OEWS 2025 (SOC 17-2071). Once you factor in Burlington's price level (1% above national, BEA RPP 100.9), that paycheck buys what $115,202 would nationally. Nominal pay sits 10.1% below the Vermont state average.
Official BLS data · View source
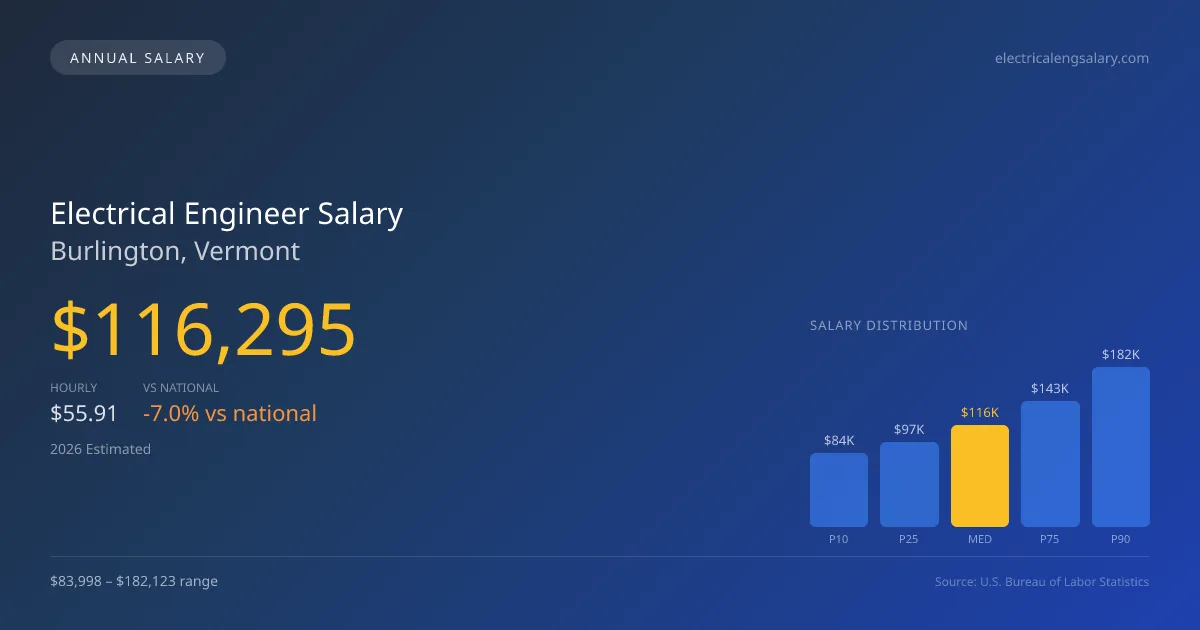
For electrical engineers in Burlington, Vermont, the 2026 median annual salary stands at $116,295, which is slightly lower than the national median of $125,033. The salary range for this profession in the area is quite broad, spanning from $83,998 at the 10th percentile to $182,123 at the 90th percentile, reflecting significant differences in individual skills, industry sectors, and levels of experience. This salary data, derived from 2025 BLS OEWS surveys and projected to 2026, illustrates how professionals can expect substantial compensation growth as they progress along their career pathways. Burlington’s market offers opportunities across both electrical engineering management and individual contributor (IC) tracks, each with distinct compensation trajectories.
Salary Breakdown
| Percentile | Annual | Hourly |
|---|---|---|
| Entry Level (P10) | $83,998 | $40.38 |
| Lower Range (P25) | $97,027 | $46.65 |
| Median (P50)(typical) | $116,295 | $55.91 |
| Upper Range (P75) | $143,317 | $68.91 |
| Top Earners (P90) | $182,123 | $87.55 |
Median Salary Position
6.99% below the national average
2026 Salary Percentile Distribution in Burlington
In Burlington, VT, the electrical engineer salary spread from the 10th to 90th percentile is $98,125 (2026 est.). At $116,295, the local median is 6.99% below the national median of $125,033.
Salary Calculator
At 40 hours/week in Burlington: You'd be in the lower-middle range
How Burlington Electrical Engineer Pay Compares
Burlington median: $116,295/year (2026)
| Compared To | Median Salary | Burlington Pays |
|---|---|---|
| Vermont Average | $129,361 | -10.10% less |
| National Average | $125,033 | -6.99% less |
Electrical Engineers in Burlington, VT earn a median of $116,295 per year (2026 est.), which is 6.99% lower than the national median of $125,033 and 10.10% below the Vermont state average of $129,361.
Cost-of-Living Adjusted Salary
Burlington has a cost of living 0.95% above the national average.
Adjusted salary = nominal × (100 / CoL index). CoL index: 100 = national average.
Burlington, VT has a cost-of-living index of 100.949 (above the national average of 100). While the nominal salary of $116,295 is competitive, the higher cost of living reduces purchasing power to an effective $115,202 — a 0.94% reduction.
Compare Purchasing Power
Select a city to see how your salary compares after cost of living
Select a city above to compare purchasing power
2019 BLS Actual
$91,644
2025 BLS Actual
$112,200
2026 Current Est.
$116,295
2019–2027 Growth
+31.5%
Salary Trajectory for Electrical Engineers in Burlington (2019–2027)
2019–2025: actual BLS OEWS data for this metro area. 2026+: CAGR 3.65% projection.
| Year | Annual Salary | Status |
|---|---|---|
| 2019 | $91,644 | Actual |
| 2020 | $110,750 | Actual |
| 2021 | $99,420 | Actual |
| 2022 | $103,120 | Actual |
| 2023 | $104,580 | Actual |
| 2024 | $109,190 | Actual |
| 2025 | $112,200 | Actual |
| 2026(current) | $116,295 | Estimated |
| 2027 | $120,540 | Projected |
Based on 7 years of BLS OEWS data for the Burlington metropolitan area, the median electrical engineer salary grew 22.4% from $91,644 (2019) to $112,200 (2025). At a 3.65% compound annual growth rate, salaries are projected to reach $120,540 by 2027 — a total increase of $28,896 (31.53%) from 2019.
Note: Historical values (2019–2025) are actual BLS OEWS figures for the Burlington metropolitan area, sourced from annual Occupational Employment and Wage Statistics surveys. 2026–2026 figures are current estimates, and 2027 values are projections, calculated using a 3.65% CAGR derived from 7-year BLS historical data. Actual salaries may vary based on employer, experience, certifications, and local market conditions.
Salary by Experience Level
| Experience | Estimated Salary Range |
|---|---|
| 0-2 years (New Graduate) | $83,998 – $97,027 |
| 3-5 years (Mid Career) | $97,027 – $116,295 |
| 5+ years (Experienced) | $116,295 – $143,317 |
| 10+ years (Top Earner) | $143,317 – $182,123 |
EE salary ranges estimated from BLS percentile data. Individual electrical engineer compensation varies by employer, certifications, and specialization.
Electrical Engineer Job Market in Burlington
Analyzing the job market in Burlington, 590 electrical engineers are currently employed, indicating a robust industry presence. The cost-of-living index for the area is slightly above the national average at 100.949, which impacts purchasing power and overall take-home pay. Local employers, particularly in the semiconductor space and major tech firms like Apple and Nvidia, tend to offer the highest salaries. Other sectors such as defense contracting and utilities provide competitive pay, but often with different benefits and job security considerations. The variability in salaries reflects industry dynamics; specialization in areas like chip design or obtaining cleared status for defense roles can significantly enhance earning potential. For those looking to optimize their electrical engineer pay in Burlington, pursuing advanced degrees, accumulating relevant certifications, or transitioning into high-demand sectors can yield notable financial rewards over time.
More salary data for Burlington, VT:
Frequently Asked Questions
How much do electrical engineers make in Burlington, VT in 2026?
Is Burlington, VT a good place to work as a electrical engineer?
Can electrical engineers make $100K in Burlington?
What is the cost-of-living adjusted electrical engineer salary in Burlington?
How much does a electrical engineer make per hour in Burlington?
Related Pages
Compare Salaries
Career Resources
Nearby Cities in Vermont
Written by Amina Patel, MEng, PE
Career Analyst
Amina has over 10 years of experience in power systems engineering. She works at a utility company specializing in renewable energy integration.
Methodology & Data Source
Salary figures on this page are 2026 projections based on the Bureau of Labor Statistics Occupational Employment and Wage Statistics (OEWS) survey, May 2026 release. The BLS reported a median annual salary of $112,200 for electrical engineersin the Burlington metropolitan area. A 3.65% compound annual growth rate (CAGR), calculated from 6-year national BLS wage trends, was applied to project current 2026 compensation. Percentile ranges (P10–P90) represent the full salary distribution across experience levels and practice settings in this market.
Data Sources & Methodology
Source: BLS, OEWS, 6-year dataset (–). Per-city data from annual BLS metropolitan area surveys.
2026 figures are projected from 2025 BLS data using a compound annual growth rate (CAGR) of 3.65%, derived from historical BLS wage trends for electrical engineers (SOC 17-2071).
Compiled and verified by Amina Patel, MEng, PE, a licensed electrical engineer with 10+ years of clinical experience. · View source data at BLS.gov