Electrical Engineer Salary in Lynchburg, VA: $102,271 (2026)
Quick Answer:A full-time electrical engineer in Lynchburg, VA earns a median $102,271/year (≈ $49.17/hour) in nominal terms for 2026 — projected from BLS OEWS 2025 (SOC 17-2071). Once you factor in Lynchburg's price level (11% below national, BEA RPP 89.4), that paycheck buys what $114,444 would nationally. Nominal pay sits 9.4% below the Virginia state average.
Official BLS data · View source
In Lynchburg, Virginia, electrical engineers can expect a median annual salary of $102,271 in 2026, which is significantly lower than the national average of $125,033 for the same year. Salary ranges for this profession reveal wide variability, with entry-level positions starting around $77,126 and experienced engineers earning up to $158,025. These figures are based on 2025 BLS OEWS data projected to 2026. As the local job market continues to evolve, demand for qualified electrical engineers remains strong, particularly for those with security clearances, which further enhances earning potential in specific sectors.
Salary Breakdown
| Percentile | Annual | Hourly |
|---|---|---|
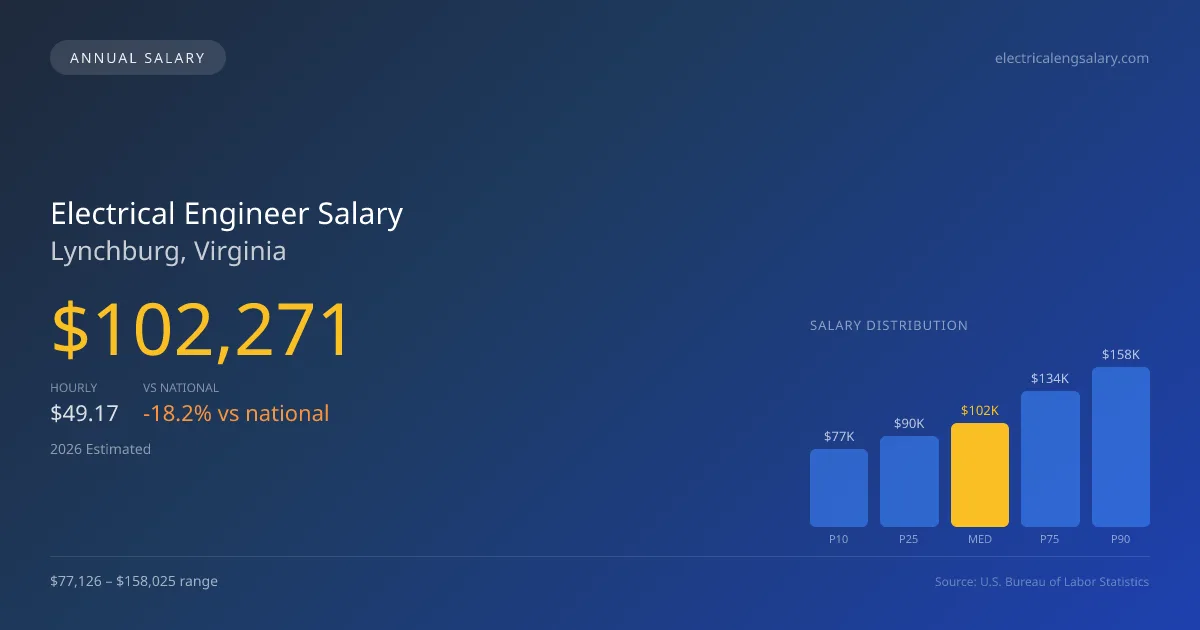
| Entry Level (P10) | $77,126 | $37.08 |
| Lower Range (P25) | $89,958 | $43.25 |
| Median (P50)(typical) | $102,271 | $49.17 |
| Upper Range (P75) | $134,486 | $64.66 |
| Top Earners (P90) | $158,025 | $75.98 |
Median Salary Position
18.2% below the national average
2026 Salary Percentile Distribution in Lynchburg
In Lynchburg, VA, the electrical engineer salary spread from the 10th to 90th percentile is $80,899 (2026 est.). At $102,271, the local median is 18.2% below the national median of $125,033.
Salary Calculator
At 40 hours/week in Lynchburg: You'd be in the lower-middle range
How Lynchburg Electrical Engineer Pay Compares
Lynchburg median: $102,271/year (2026)
| Compared To | Median Salary | Lynchburg Pays |
|---|---|---|
| Virginia Average | $112,882 | -9.40% less |
| National Average | $125,033 | -18.20% less |
Electrical Engineers in Lynchburg, VA earn a median of $102,271 per year (2026 est.), which is 18.20% lower than the national median of $125,033 and 9.40% below the Virginia state average of $112,882.
Cost-of-Living Adjusted Salary
Lynchburg has a cost of living 10.64% below the national average, meaning your salary goes further here.
Adjusted salary = nominal × (100 / CoL index). CoL index: 100 = national average.
Lynchburg, VA has a cost-of-living index of 89.363 (below the national average of 100). A electrical engineer earning $102,271 nominally has purchasing power equivalent to $114,444 in an average-cost city — an effective 11.9% boost.
Compare Purchasing Power
Select a city to see how your salary compares after cost of living
Select a city above to compare purchasing power
2019 BLS Actual
$94,250
2025 BLS Actual
$98,670
2026 Current Est.
$102,271
2019–2027 Growth
+12.5%
Salary Trajectory for Electrical Engineers in Lynchburg (2019–2027)
2019–2025: actual BLS OEWS data for this metro area. 2026+: CAGR 3.65% projection.
| Year | Annual Salary | Status |
|---|---|---|
| 2019 | $94,250 | Actual |
| 2020 | $93,700 | Actual |
| 2021 | $93,650 | Actual |
| 2022 | $86,140 | Actual |
| 2023 | $95,230 | Actual |
| 2024 | $102,310 | Actual |
| 2025 | $98,670 | Actual |
| 2026(current) | $102,271 | Estimated |
| 2027 | $106,004 | Projected |
Based on 7 years of BLS OEWS data for the Lynchburg metropolitan area, the median electrical engineer salary grew 4.7% from $94,250 (2019) to $98,670 (2025). At a 3.65% compound annual growth rate, salaries are projected to reach $106,004 by 2027 — a total increase of $11,754 (12.47%) from 2019.
Note: Historical values (2019–2025) are actual BLS OEWS figures for the Lynchburg metropolitan area, sourced from annual Occupational Employment and Wage Statistics surveys. 2026–2026 figures are current estimates, and 2027 values are projections, calculated using a 3.65% CAGR derived from 7-year BLS historical data. Actual salaries may vary based on employer, experience, certifications, and local market conditions.
Salary by Experience Level
| Experience | Estimated Salary Range |
|---|---|
| 0-2 years (New Graduate) | $77,126 – $89,958 |
| 3-5 years (Mid Career) | $89,958 – $102,271 |
| 5+ years (Experienced) | $102,271 – $134,486 |
| 10+ years (Top Earner) | $134,486 – $158,025 |
EE salary ranges estimated from BLS percentile data. Individual electrical engineer compensation varies by employer, certifications, and specialization.
Electrical Engineer Job Market in Lynchburg
The job market in Lynchburg employs around 160 electrical engineers, with a cost of living index at 89.363, indicating a reasonable standard of living relative to other regions. This affordability allows engineers to stretch their salaries further. Top-paying employers include defense contractors such as Lockheed Martin and Northrop Grumman, which often require security clearances and pay a premium. While semiconductor and tech companies are known for high salaries, the disparity in pay across different industries—such as automotive and utilities—highlights the importance of specialization in maximizing earning potential. Engineers looking to increase their compensation may benefit from pursuing advanced degrees or certifications, as well as seeking positions with companies that offer extensive benefits or performance incentives. Understanding local market dynamics, especially in relation to security clearance and the semiconductor sector, can greatly influence how much electrical engineers make in Lynchburg, VA.
More salary data for Lynchburg, VA:
Frequently Asked Questions
How much do electrical engineers make in Lynchburg, VA in 2026?
Is Lynchburg, VA a good place to work as a electrical engineer?
Can electrical engineers make $100K in Lynchburg?
What is the cost-of-living adjusted electrical engineer salary in Lynchburg?
How much does a electrical engineer make per hour in Lynchburg?
Related Pages
Compare Salaries
Career Resources
Nearby Cities in Virginia
Written by Amina Patel, MEng, PE
Career Analyst
Amina has over 10 years of experience in power systems engineering. She works at a utility company specializing in renewable energy integration.
Methodology & Data Source
Salary figures on this page are 2026 projections based on the Bureau of Labor Statistics Occupational Employment and Wage Statistics (OEWS) survey, May 2026 release. The BLS reported a median annual salary of $98,670 for electrical engineersin the Lynchburg metropolitan area. A 3.65% compound annual growth rate (CAGR), calculated from 6-year national BLS wage trends, was applied to project current 2026 compensation. Percentile ranges (P10–P90) represent the full salary distribution across experience levels and practice settings in this market.
Data Sources & Methodology
Source: BLS, OEWS, 7-year dataset (–). Per-city data from annual BLS metropolitan area surveys.
2026 figures are projected from 2025 BLS data using a compound annual growth rate (CAGR) of 3.65%, derived from historical BLS wage trends for electrical engineers (SOC 17-2071).
Compiled and verified by Amina Patel, MEng, PE, a licensed electrical engineer with 10+ years of clinical experience. · View source data at BLS.gov